
+ 1
trillion pesos
market cap on November 1 st, 2019
88
%
of our stores
are supplied with renewable energy
1
.
5
billion pesos
channeled through social impact programs
Finance Value
2019 was a year of transformation, of investment, and results. We focused on building an
even more customer-centric business, better positioned for the future, while delivering
solid results within a very challenging macroeconomic environment.
We were able to leverage our capabilities inside and
outside the store. We surpassed the number of stores
opened in the last five years and continued to accelerate
growth in eCommerce sales.
We continue creating value for all of our stakeholders.
The Walmart of the Future is happening today.

Olga González
Senior Vice President and Chief Financial Officer
Walmart de México y Centroamérica
Walmart de México y Centroamérica

MESSAGE
Performance
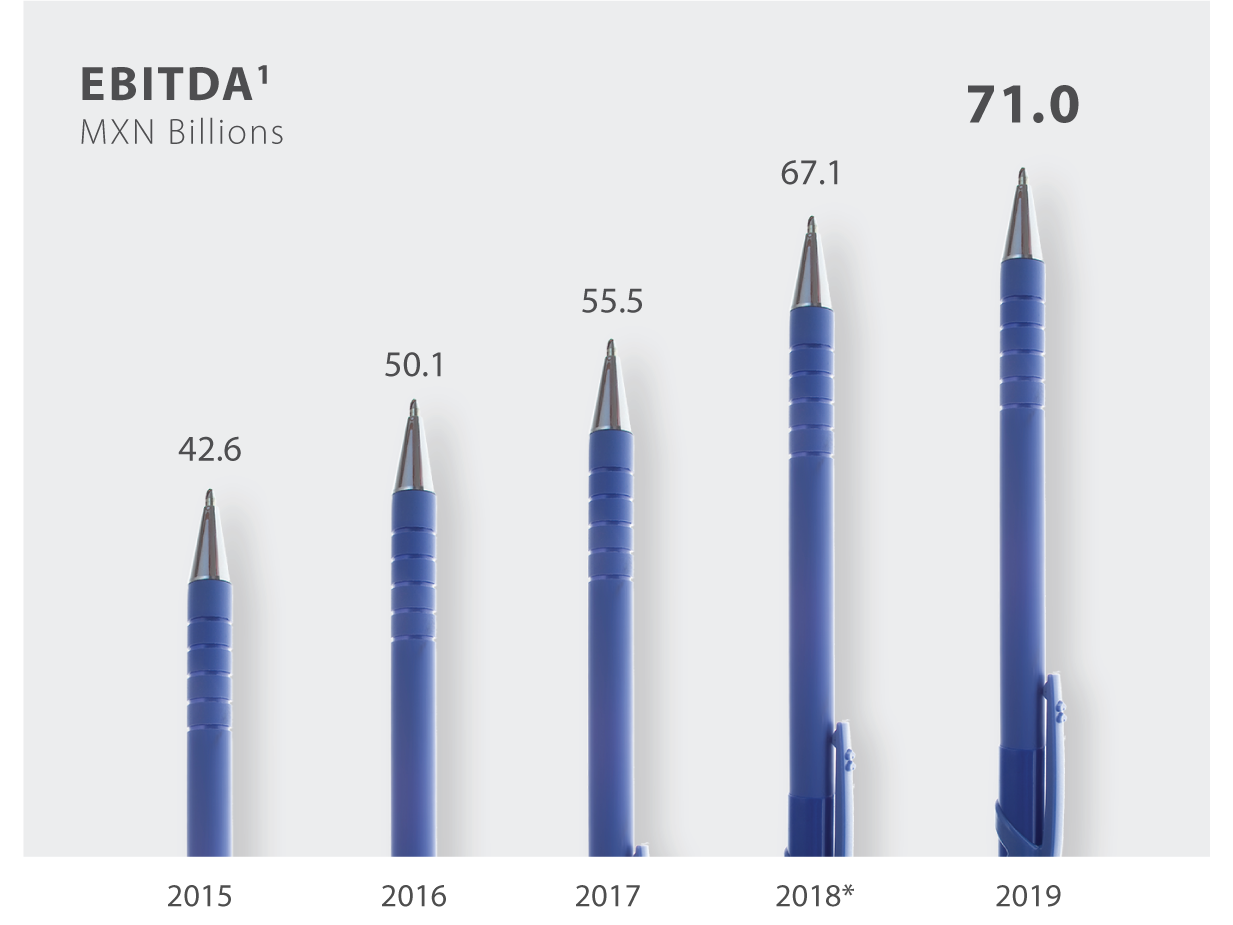
In 2019, we achieved solid results and continued to grow steadily and profitably in sales and EBITDA.
We invested in expanding our omnichannel coverage, eCommerce, technology, salaries, and logistics
to meet our customers’ new purchasing habits and preferences. We manage our stores and clubs
with discipline, the efficiencies achieved have helped us to generate the necessary resources to keep
driving future growth and increase profitability.
Growth by country, format and division
In Mexico, all regions and formats delivered a positive performance. The North and
South regions had the highest same-stores sales growth, followed by the Center and
Metro regions, which delivered softer growth due to the competitive dynamics and
macro conditions in those regions.
Same-store
sales grownth
sales grownth

Mexico
4
.
4
%


Central America
0.
4
%


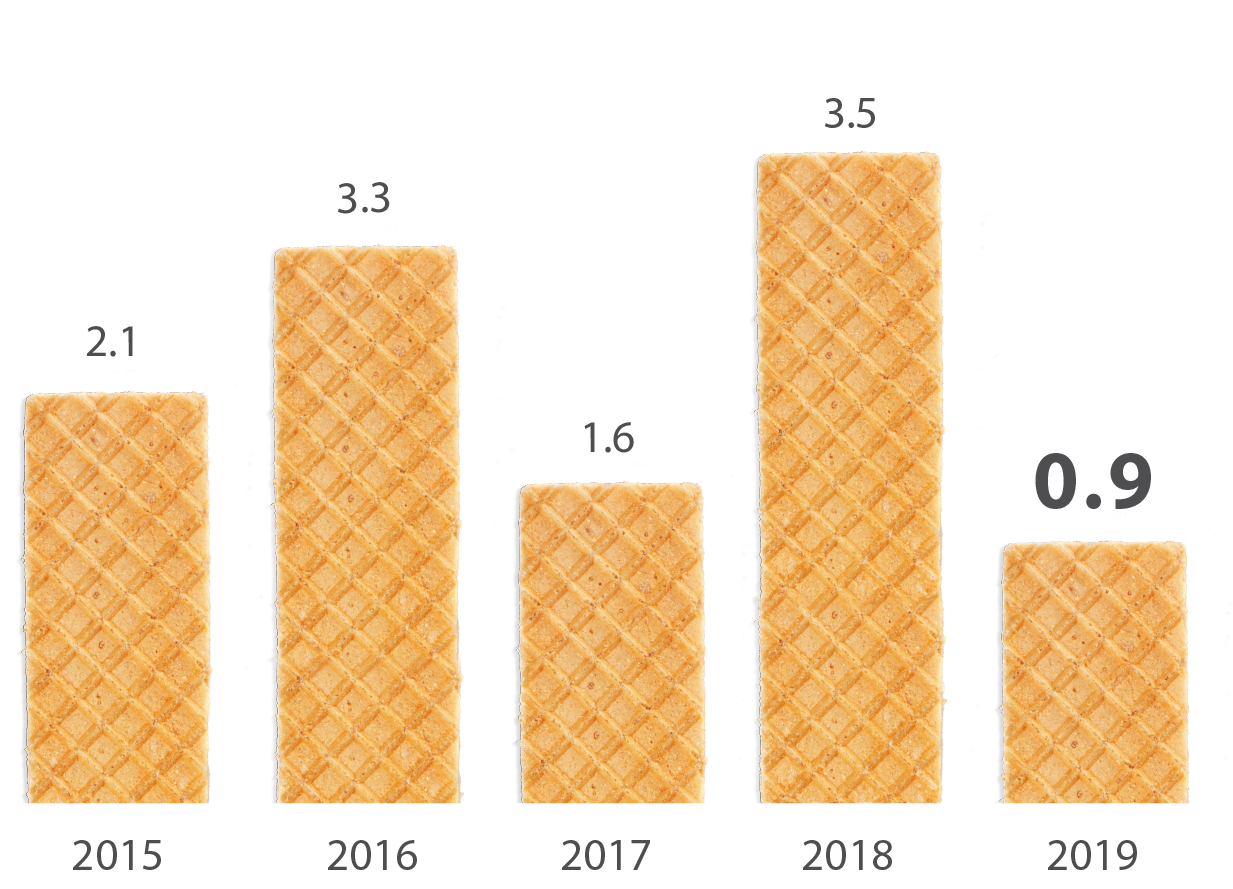
Differential growth in same-store sales Walmex 1 vs ANTAD Self-service and Clubs 2
Percentage points
In 2019, we surpassed ANTAD’s self-service and clubs same-stores sales
growth by 90 basis points. With this, we have been able to accumulate five-year
higher growth at same-stores than our direct competitors.
1 Self-service and Sam’s Club
2 Excluding Walmex
In Mexico
Total revenue was 532.2 billion pesos, which represented a 5.7% growth compared to
2018. All formats and regions grew, our largest division, Food and Consumables, grew
the fastest.
We continue to accelerate our eCommerce business growth; in 2019 GMV’s sales rose by
61%3, reflecting the fact that our omnichannel offer is gaining momentum. A 52% online
net sales annual growth was reached, this figure is higher than the 40% growth of 2018
and shows the correct execution of our digital transformation strategy along with efficient
investments made in logistics network. eCommerce sales represented 1.5% of total sales and
contributed 50 basis points to total sales growth.
To strengthen our leadership in the market and increase customer transactions, we invested
in pricing and widened the price gap with the competition by 20 basis points. These
commercial efforts reduced the gross margin by 10 basis points, which this year represented
22.6% of total revenue.
SG&A for the year grew 3.5%, 220 basis points below revenue growth, as a result of our
efforts in productivity and operating efficiencies.
Thanks to sales growth, good margin management to maintain competitiveness, along with
disciplined expense control, operating income grew 8.3% and represented 8.9% of total
revenue, and EBITDA grew 8.6%, representing 11.4% of revenue.

3 eCommerce GMV’s growth mentioned above excludes call center sales.
Note: Last year references are based on the pro-forma 2018 figures adjusted due to the adoption of the IFRS 164.
Note: Last year references are based on the pro-forma 2018 figures adjusted due to the adoption of the IFRS 164.
114
.
6
billion pesos
in Central America of total
revenue +3.4% vs 2018
revenue +3.4% vs 2018
In Central America
Total revenue reached 114.6 billion pesos
increasing 3.4% over the previous year, on a
constant currency basis. Looking at performance
by country, Honduras had the highest growth,
followed by Nicaragua and El Salvador. The
lowest sales performance was in Costa Rica
and Guatemala, reflecting the unfavorable
macroeconomic dynamics in those countries.
Gross margin remained at 24.2%, as the team
achieved the right balance of maintaining price
leadership without compromising profitability.
Expenses increased 10.8%, impacted by the
new intellectual property royalties’ agreement
between our Central American subsidiaries and
Walmart Inc. The agreement came into force
in 2019, but the annual charge was recorded
in the fourth quarter, affecting expenses in 1.6
billion pesos. Excluding this impact from the
annual result, expenses would have grown 2.6%,
achieving a leverage of 10 basis points.
Operating income represented 5.8% of total
revenue. Without the effect of royalties, it
would have been 7.1%, an increase of 20 basis
points and a 7.1% growth compared to 2018.
EBITDA represented 9.1% of total revenue.
Excluding the effect of royalties, it would be
10.5%, with an increase of 50 basis points and a
7.8% growth compared to 2018.
114
.
6
billion pesos
in Central America of total
revenue +3.4% vs 2018
revenue +3.4% vs 2018
646
.
8
billion pesos
at a consolidated level total
revenue +4.9% vs 2018
revenue +4.9% vs 2018
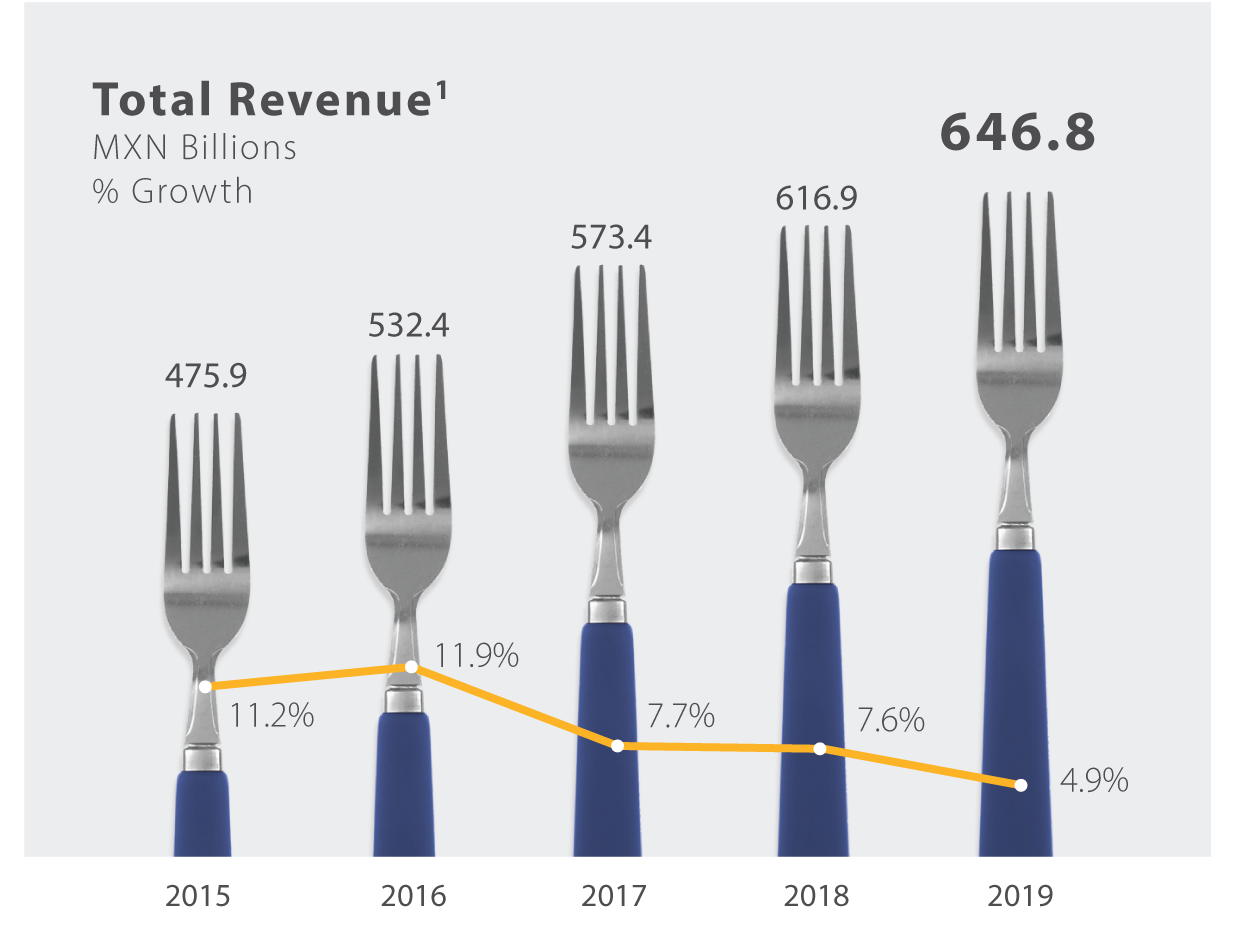
Consolidated figures
Consolidated revenue reached 646.8 billion
pesos and increased 4.9% compared to 2018.
Gross margin of 22.9% was reduced by 10 basis
points mainly due to our continued commitment
to price investment.
Expenses grew 4.6% compared to 2018, without
considering the effect of Central American
royalties, growth would be 2.9%, with which we
leveraged the expense in 20 basis points. The
latter was achieved by exercising an excellent
display of discipline in expense control in both
regions.
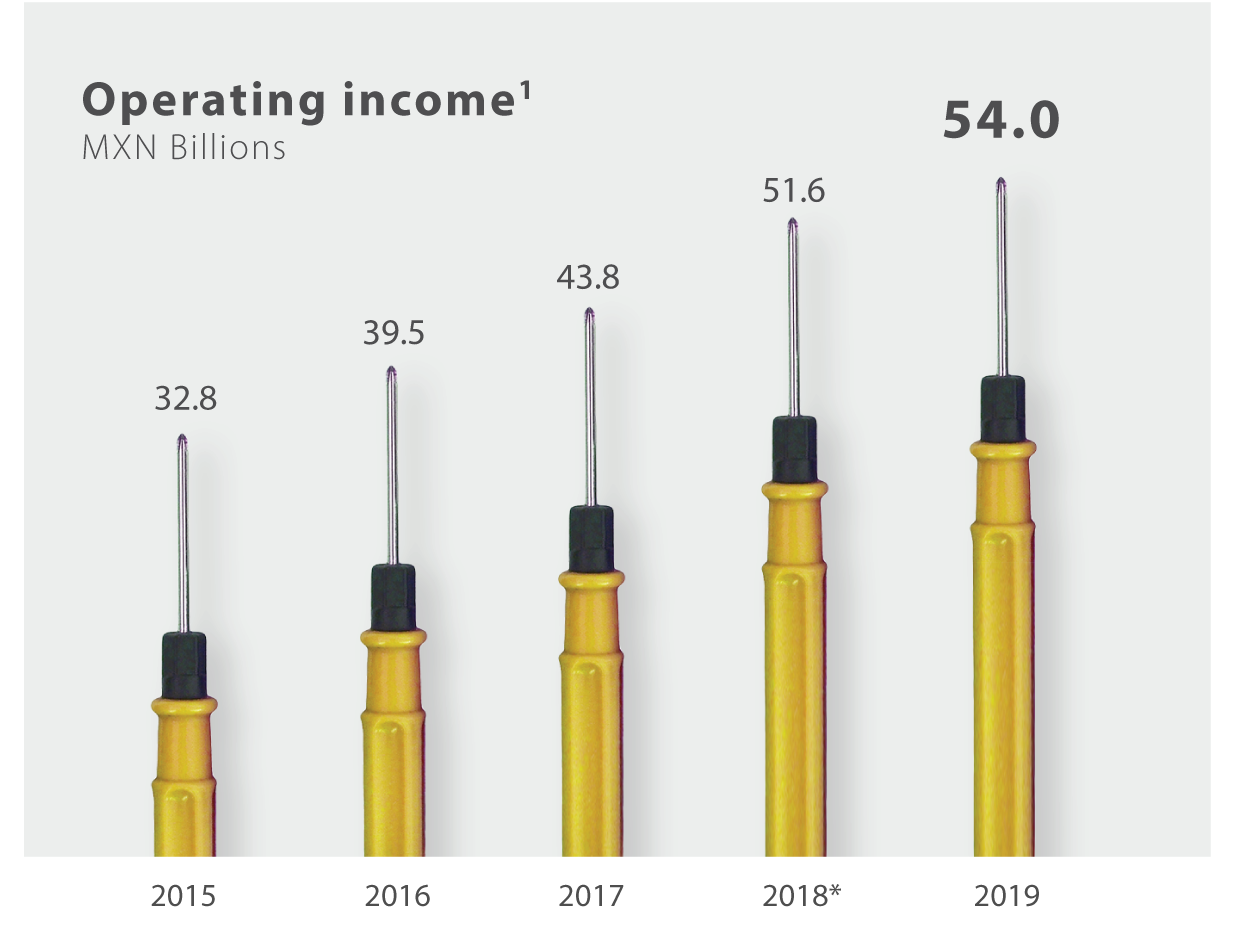
Operating income represented 8.3% of total
revenue. Excluding the effect of royalties, it
would represent 8.6% with an increase of 20
basis points and a 7.8% growth over the previous
year. EBITDA reached 71.0 billion pesos, 11.0%
of total revenue. Without considering the effect
of royalties, it would be 72.6 billion pesos and a
11.2% margin, with an increase of 30 basis points
and an 8.1% growth compared to 2018.
646
.
8
billion pesos
at a consolidated level total
revenue +4.9% vs 2018
revenue +4.9% vs 2018
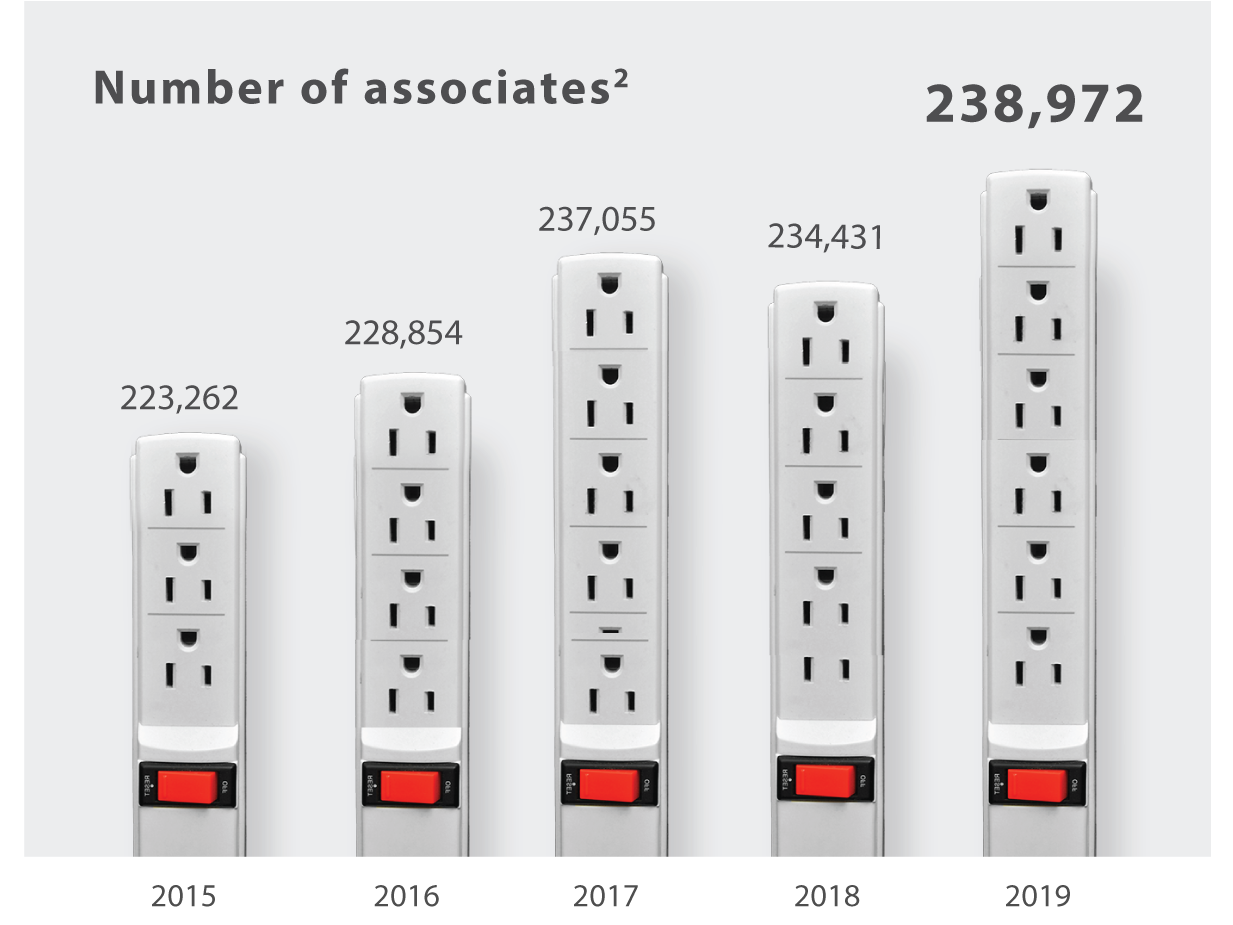
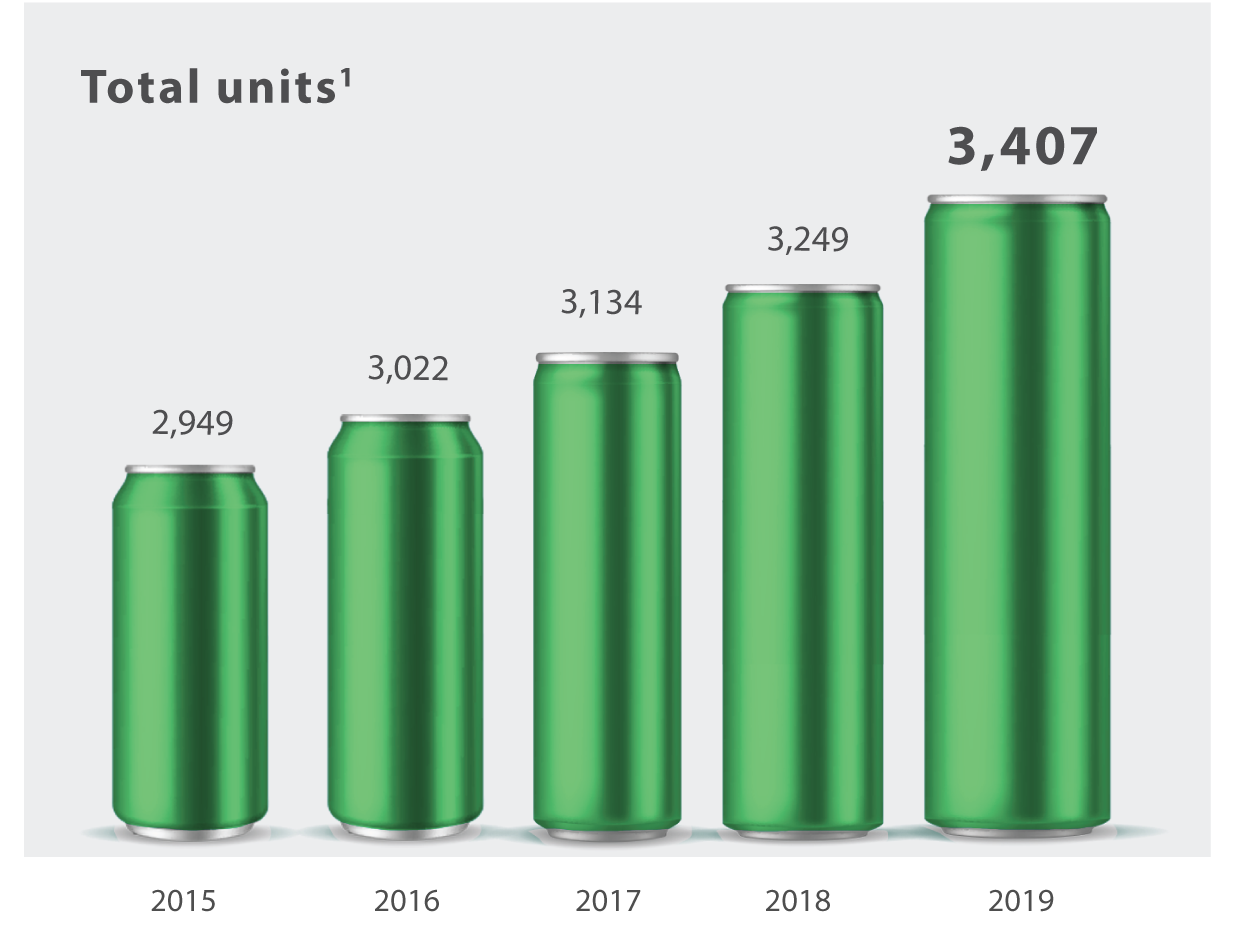
Key performance
indicators
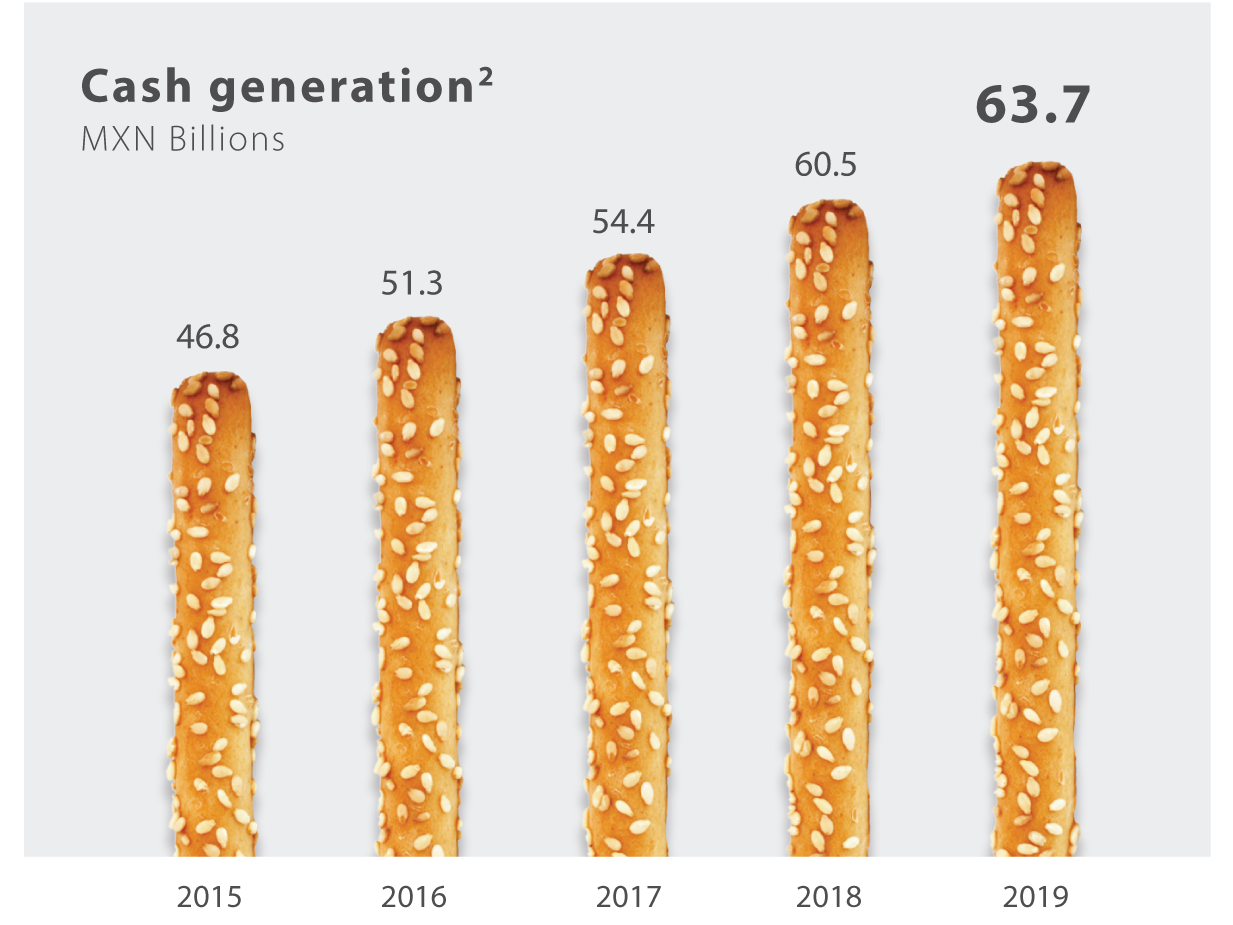
Supported by strong
cash flow generation,
operating with
quality and financial
discipline, we keep
investing to continue
our leadership in
the future.
1 Walmex excluding Banco Walmart
and Suburbia.
2 Excluding Suburbia since 2016.
* Last year references are based on the pro-forma 2018 figures adjusted due to the adoption of the IFRS 164.
1 Walmex excluding Banco Walmart
and Suburbia.
2 Excluding Suburbia since 2016.
* Last year references are based on the pro-forma 2018 figures adjusted due to the adoption of the IFRS 164.
Value for Shareholders
Our stock reached a historical high
of 59.04 pesos this year, as a sign
of confidence in our operation,
financial strength, and efficient
use of assets. We are building
the Walmart of the future from a
position of strength.
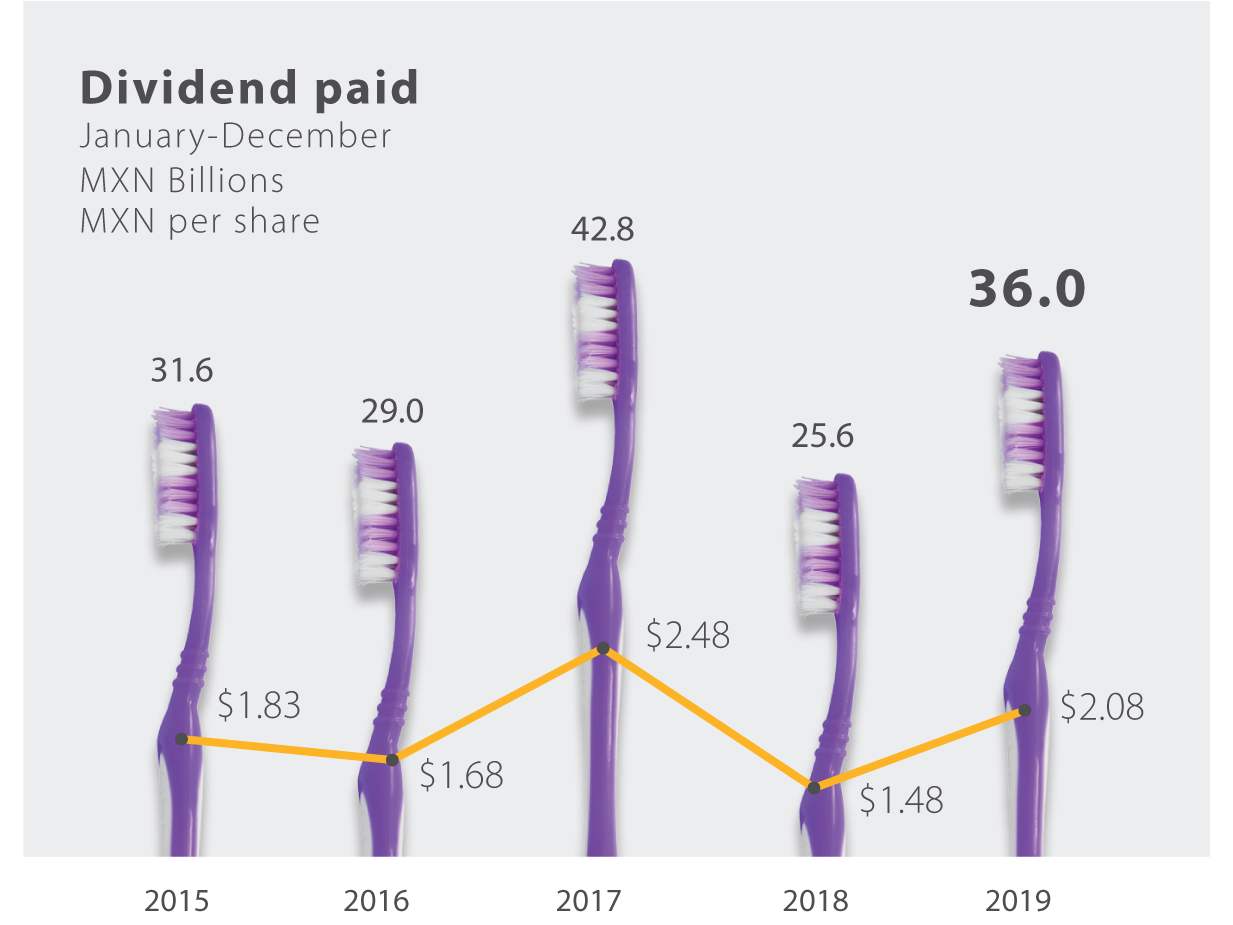
We consistently reward the trust of
our shareholders. This year, we paid
35.96 billion pesos in dividends,
which include the fourth payment
decreed in 2018 for 0.33 pesos
per share, 0.19 pesos for ordinary
dividend, and 0.14 pesos for
extraordinary dividend, plus 1.75
pesos per share, corresponding
to the payment decreed in 2019,
which is composed of an ordinary
dividend of 0.84 pesos per share
and an extraordinary dividend of
0.91 pesos per share, both paid in
three installments, the ordinary
dividend of 0.28 pesos per share, in
April, August, and November 2019
and extraordinary dividend of 0.35
pesos per share in April, 0.30 in
August, and 0.26 in November 2019.

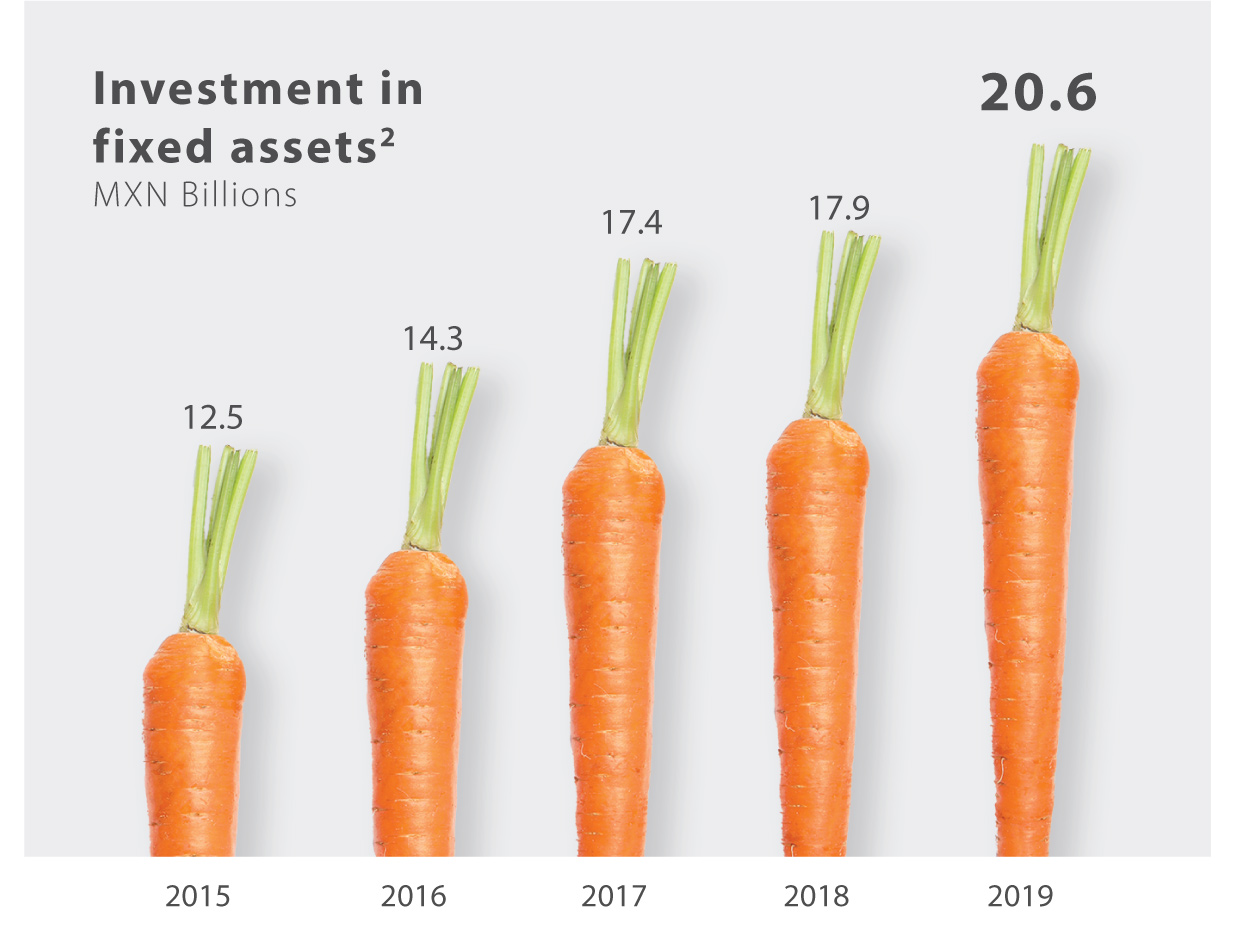
Investments
We balanced the short and long-term investments,
allocating resources to our low-price proposal and
salaries, while, with a long-term perspective, we
built the infrastructure and capacities that will allow
us to continue on the road to success. We invested
20.58 billion pesos in capital expenses during the
year, of which we allocated 40% to maintaining
and remodeling existing stores, 28% to new stores
openings, 20% to the logistics network, 11% to
eCommerce and technology, and 1% to the fresh
upstreaming projects.
We opened two distribution centers in Mexico
dedicated to eCommerce in Monterrey and
Guadalajara, with an investment of 370 million
pesos, significantly improving delivery in 17 states
of the country. In Costa Rica, we expanded the Coyol
distribution center, making it the largest in Central
America.
We surpassed the number of new stores opened
in the last five years, opening 161 units in 2019,
134 in Mexico, and 27 in Central America. The new
stores added more than 1.7 million ft2 of sales floor,
contributing 1.7% to sales growth and 2.1% to the
increase in installed capacity.
We continue to make our investments more efficient
in order to adjust our value proposal to different
markets. We opened new prototype stores with the
same customer value proposition with only a few
changes in assortment and store size to adapt it to
the market where it is located.
With a long-term perspective, we built the
infrastructure and capacities that will allow us to
continue on the road to success.
76
,
414
,
319
ft2
added to sales floor
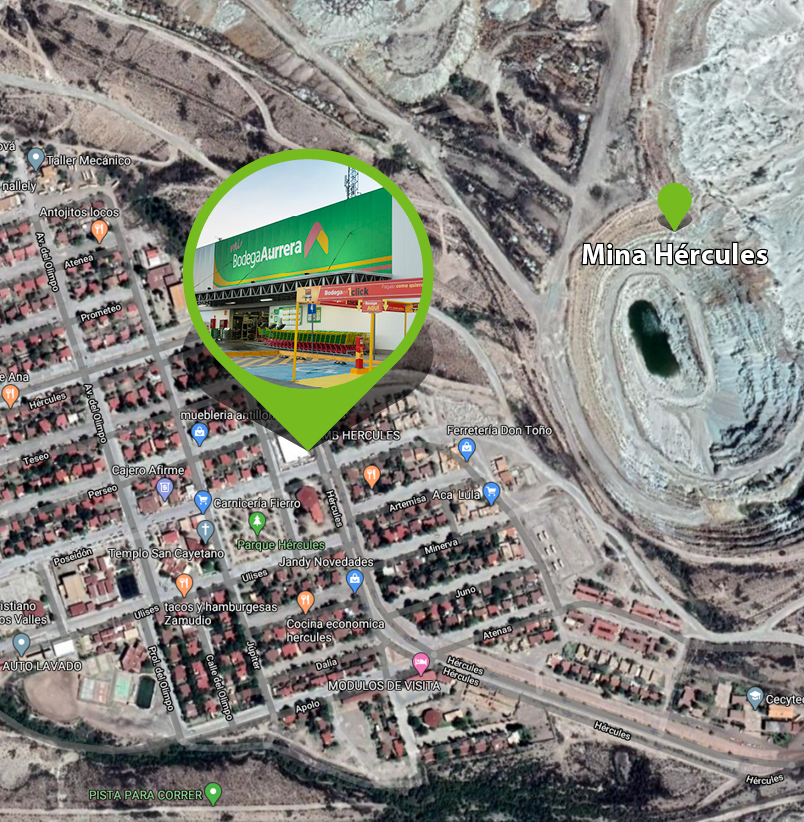
Source: Map data ©2019 Google
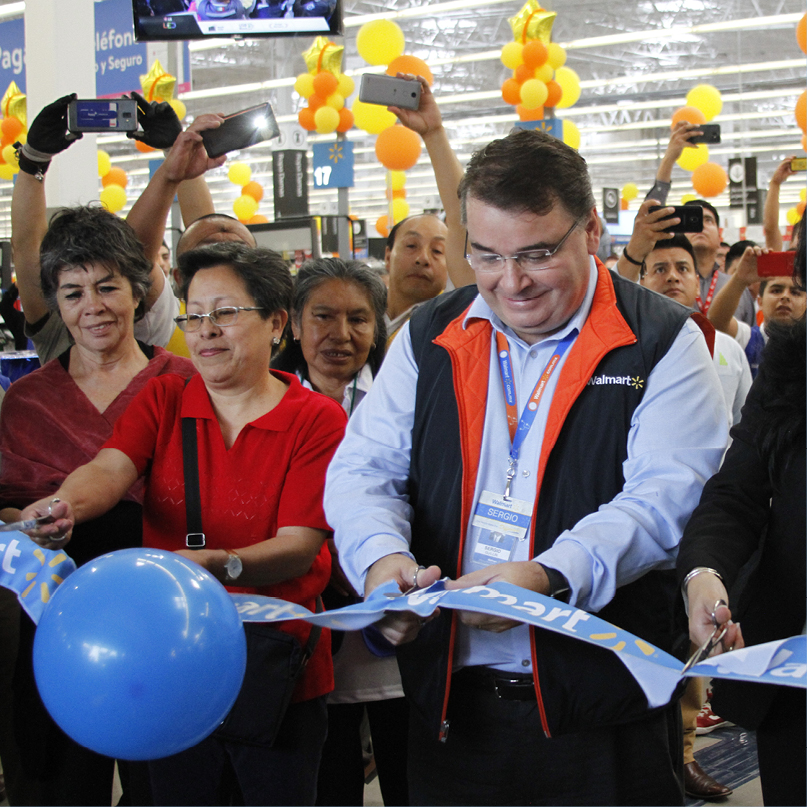
This year, we opened the Mi Bodega Hercules
store, located in a mining region on the border
of Coahuila and Chihuahua.
Our transformation also emphasizes inclusion.
This year, we opened five inclusive stores,
which offer greater autonomy to our customers
and associates with disabilities. Walmart Punta
Guadiana in Durango, was the first inclusive
store we opened, which has help buttons,
preferential points of entry, accessible furniture,
and tactile guides.
Through our philosophy of everyday low price
and productivity, we continue to strategically
manage capital to deliver value to our
shareholders and all our stakeholders.
2019 was a year of results, transformation, and
challenges, and we continue to generate new
opportunities to maintain our strength in the
future.
We used our scale in a positive way, being careful to
generate returns on capital and to make a positive
contribution in the communities where we serve.
Income Statement and Balance Sheet
At December 31, 2019 (MXN Billions)
Consolidated Results Walmex 2019


4 In order to provide the investors community a better view of the underlying performance of our business, we are including a retroactive estimation of the effect the adoption of the IFRS 16 would have had on 2018 financial results. These pro-forma 2018 figures are not audited, but are based on the 2018 audited reported results and adjusted with our best estimates to show the effects related to the adoption of the IFRS 16. Please note that all the references that will be done to last year’s results are based on 2018 pro-forma figures.
