THE RESULT:
to deliver
value
WE ARE VERY PROUD OF THE ACHIEVEMENTS OBTAINED IN THE YEAR, RESULT OF OUR CONSTANT IMPROVEMENT IN OPERATION AND FINANCIAL STRENGTH


Milton Brandt
Senior Vice President and Chief Financial Officer Walmart de México y Centroamérica
FINANCIAL VALUE
2020 was undoubtedly a complicated and challenging year. At Walmart de México y Centroamérica we always strive to innovate, invest, and deliver solid results
When we set our sights on an objective, we focus and achieve it. Despite the uncertainty that prevailed, we achieved efficiency in our operational and financial management. We stablished the path to continue with sales growth and continued generating returns for our shareholders; initiatives and investments were accelerated, managing expenses with discipline and without sparing expenses to protect the health and safety of our associates and customers.
Growth by country, format and division
Same-store sales
Mexico
Central America
PERFORMANCE
Our ability to adapt and the results achieved are proof of maturity and adoption of our transformation
We continue growing our sales and operating with financial discipline, despite working amidst an environment of high expenses. Excluding one-time effects, we grew operating income and maintained a double-digit EBITDA margin. We were able to refocus our investment in omnichannel projects to reach more Mexican families, and to continue preparing our business for the future.
For the sixth consecutive year, we outpaced the self-service and clubs market, as measured by ANTAD (the Mexican retail association)
Mexico
Throughout the year, all regions grew same-store sales. The North and Metro regions posted the best performance, followed by the South and Central regions, impacted by restrictions imposed by local authorities through the epidemiological classification which was “high risk” (classification orange / red) from April to December.
Thanks to our Every Day Low Price proposition and the loyalty of our customers, our same-store sales gap grew to 130 basis points for 2020.
Growth gap in same-store sales
Walmex1 vs ANTAD
Basis points
Basis points
1 Mexico: Self-service and Sam’s Club

All formats experienced consistent growth during the year. Total revenue was 575.0 billion pesos, which represented 8.0% growth compared to 2019.
Due to the reinforcement of our omnichannel value proposition, improvements to our service levels, and continued investment in technology and digitalization, this year saw eCommerce sales accelerated and nearly tripled, thus representing 3.8% of sales, 2.5 times the penetration we had the previous year and a contribution of 260 basis points to total sales, which is a fivefold increase over 2019.
Growth in eCommerce sales was 171%, greater than the 52% posted for 2019, and GMV grew 164%.
575.0 billion
pesos of total revenue
+8.0% growth
GMV Growth

Honoring our Every Day Low Price philosophy, we worked harder than ever this year helping people save money and live better. Working hand in hand with our suppliers to contain prices during the health crisis, we were also able to extend our low-price offering with programs like Los Esenciales. Moreover, our price gap vs. competitors increased by 50 basis points and expanded our gross profit margin by 20 basis points, representing 22.8% of total revenue for the year.
50 basis points
expansion of price gap vs. competitors
SG&A increased 11.4%, as compared to the previous year. Without one-time effects, this growth would have been 9.0%, that is, 13.9% of total revenue, similar levels to 2019, a product of the operating discipline of the entire team, despite high expenses incurred due to the pandemic.
The results for the year, excluding one-time effects, were positive. Operating income grew 9.5%, 150 basis points over total revenue growth, and were able to maintain our double-digit EBITDA margin, representing 11.4% of revenue.
CENTRAL AMERICA
Total revenues reached 126.8 billion pesos, decreasing 0.3% vs. the previous year. Looking at same-store sales performance by country, Nicaragua, El Salvador and Guatemala managed to grow their sales whereas, Costa Rica and Honduras had lower sales performance due to the macroeconomic situation in the region and the restrictions implemented to contain the pandemic.
Thanks to the focus on prices and to the commercial proposal adjustment to increase essential items supply, we were able to maintain a 24.2% gross profit margin.
Note: Sales growth percentages related to Central America are determined on a constant currency basis.
Expenses were kept under control despite such challenging times and the costs incurred due to the pandemic. SG&A was leveraged by 10 basis points, as compared to 2019.
Operating income represented 5.8% of total revenue, the same level as last year, with a 0.4% drop compared to 2019.
+20 bps
EBITDA margin expansion
EBITDA represented 9.3% of total revenue, expanded by 20 basis points over 2019, stemming from our operating and financial discipline
Note: Sales growth percentages related to Central America are determined on a constant currency basis.

701.7 billion
pesos of total revenue
+8.5% growth
CONSOLIDATED
At a consolidated level, total revenues for the year reached 701.7 billion pesos, 8.5% growth over the previous year. The gross margin was 23.1%, expanded by 20 basis points compared to 2019.
SG&A increased 11.2%, as compared to 2019. Excluding one-time effects, this growth would have been 9.3%, primarily due to an environment of higher expenses incurred to face the pandemic.
Operating income represented 8.2% of total revenue. Excluding one-time effects, this would have represented 8.4%, expanded by 10 basis points and 9.7% growth over the previous year. EBITDA reached 75.4 billion pesos , 10.7% of total revenue. Excluding one-time effects, it would be 77.2 billion pesos, 11.0% of total revenue, the same level as 2019.
We shall continue to improve our cash position through the operating and financial discipline for which we are known, allowing us to continue investing and generating returns.
Our cash-flow generation is solid, consistently growing year after year

701.7 billion
pesos of total revenue
+8.5% growth
Our cash-flow generation is solid, consistently growing year after year
Sales share by business format
Clubs
Price Club membership, where we offer the best new and differentiated products in volume at irresistible prices. At Sam's Club we serve business and individual members looking for the best shopping experience whether in-store or online, we offer On Demand from all our clubs with home delivery or pickup.
Discount warehouses and discount stores
Stores focused on customers looking for the best price and value in their purchases. Through our Every Day Low Price value proposition we offer perishables, groceries, consumables, general merchandise and household items at the best prices in the market. Now also online with a wide assortment of general merchandise on our website and On Demand with same day delivery.
Supermarkets
We offer excellent quality products in departments such as perishables, groceries, consumables and selected general merchandise products, focused on providing the best shopping experience to our customers at low prices. With On Demand service with same day delivery, offering greater convenience.
Hypermarkets
Stores focused on offering a broad catalog of perishables, groceries, consumables, general merchandise and apparel through our Every Day Low Price value proposition. We offer an extended catalog from our website, where we also have a marketplace so our customers can find everything they are looking for in one place. We have enabled stores with omnichannel capabilities to offer On Demand with same-day delivery.
Our multi-format strategy allows us to meet different buying occasions in different socio-economic segments
KEY PERFORMANCE INDICATORS
Transactions
Millions
Total Revenue
MXN Billions
Operating income
MXN Billions
(EBITDA)
MXN Billions
Investment in
fixed assets
MXN Billions
Cash generation
MXN Billions
Dividend paid
Jan-Dec
MXN Billions
MXN per share
Number of associates
Total units
* In order to provide the investors community a better view of the underlying performance of our business, we are including a retroactive estimation of the effect the adoption of the IFRS 16 would have had on 2018 financial results. These pro-forma 2018 figures are not audited, but are based on the 2018 audited reported results and adjusted with our best estimates to show the effects related to the adoption of the IFRS 16.
DELIVERING RESULTS
As a result of the confidence in our operation, financial strength, and constant innovation, during the last five years our share price has reached maximum levels year after year. In 2020, our price per share reached a record high of 60.10 pesos, despite a challenging situation. Walmart de México y Centroamérica consistently evolves and innovates; we are set to continue operating the business of the future, while continuing to generate returns.
In retribution for the confidence of our shareholders, this year we paid 30.9 billion pesos in dividends. Said amount takes into account a payment of 1.79 pesos per share decreed in 2020, comprising an ordinary cash dividend of 0.87 pesos per share and an extraordinary dividend of 0.92 pesos per share. The ordinary dividend was paid in three installments; the first at 0.27 pesos per share in June 2019, and two payments of 0.30 pesos per share in November and December 2019. The extraordinary dividend was paid in two installments; the first at 0.45 pesos per share in November 2019, and the second at 0.47 pesos per share in December 2019.
INVESTMENTS
Aligning to the priorities that guided our decisions this year, we managed the short term effectively, financially, and operationally, and we continued to implement our strategy even amid the crisis. We decided to continue investing and to further strengthen our omnichannel business, which allowed us to provide an immediately and essential service to our customers during the emergency, and in the long-term, we built capabilities and infrastructure to continue evolving and innovating, ready to face future challenges.
16.7 billion
pesos invested in high-return strategic projects
7.2 million
m2 in sales floor
Despite being unable to implement our investment plans as expected, we invested 16.7 billion pesos in high-return strategic projects, of which 43% were allocated for remodeling and maintaining existing stores; 27% for opening new stores; 16% for eCommerce and technology, and 14% for redesigning our logistics network.
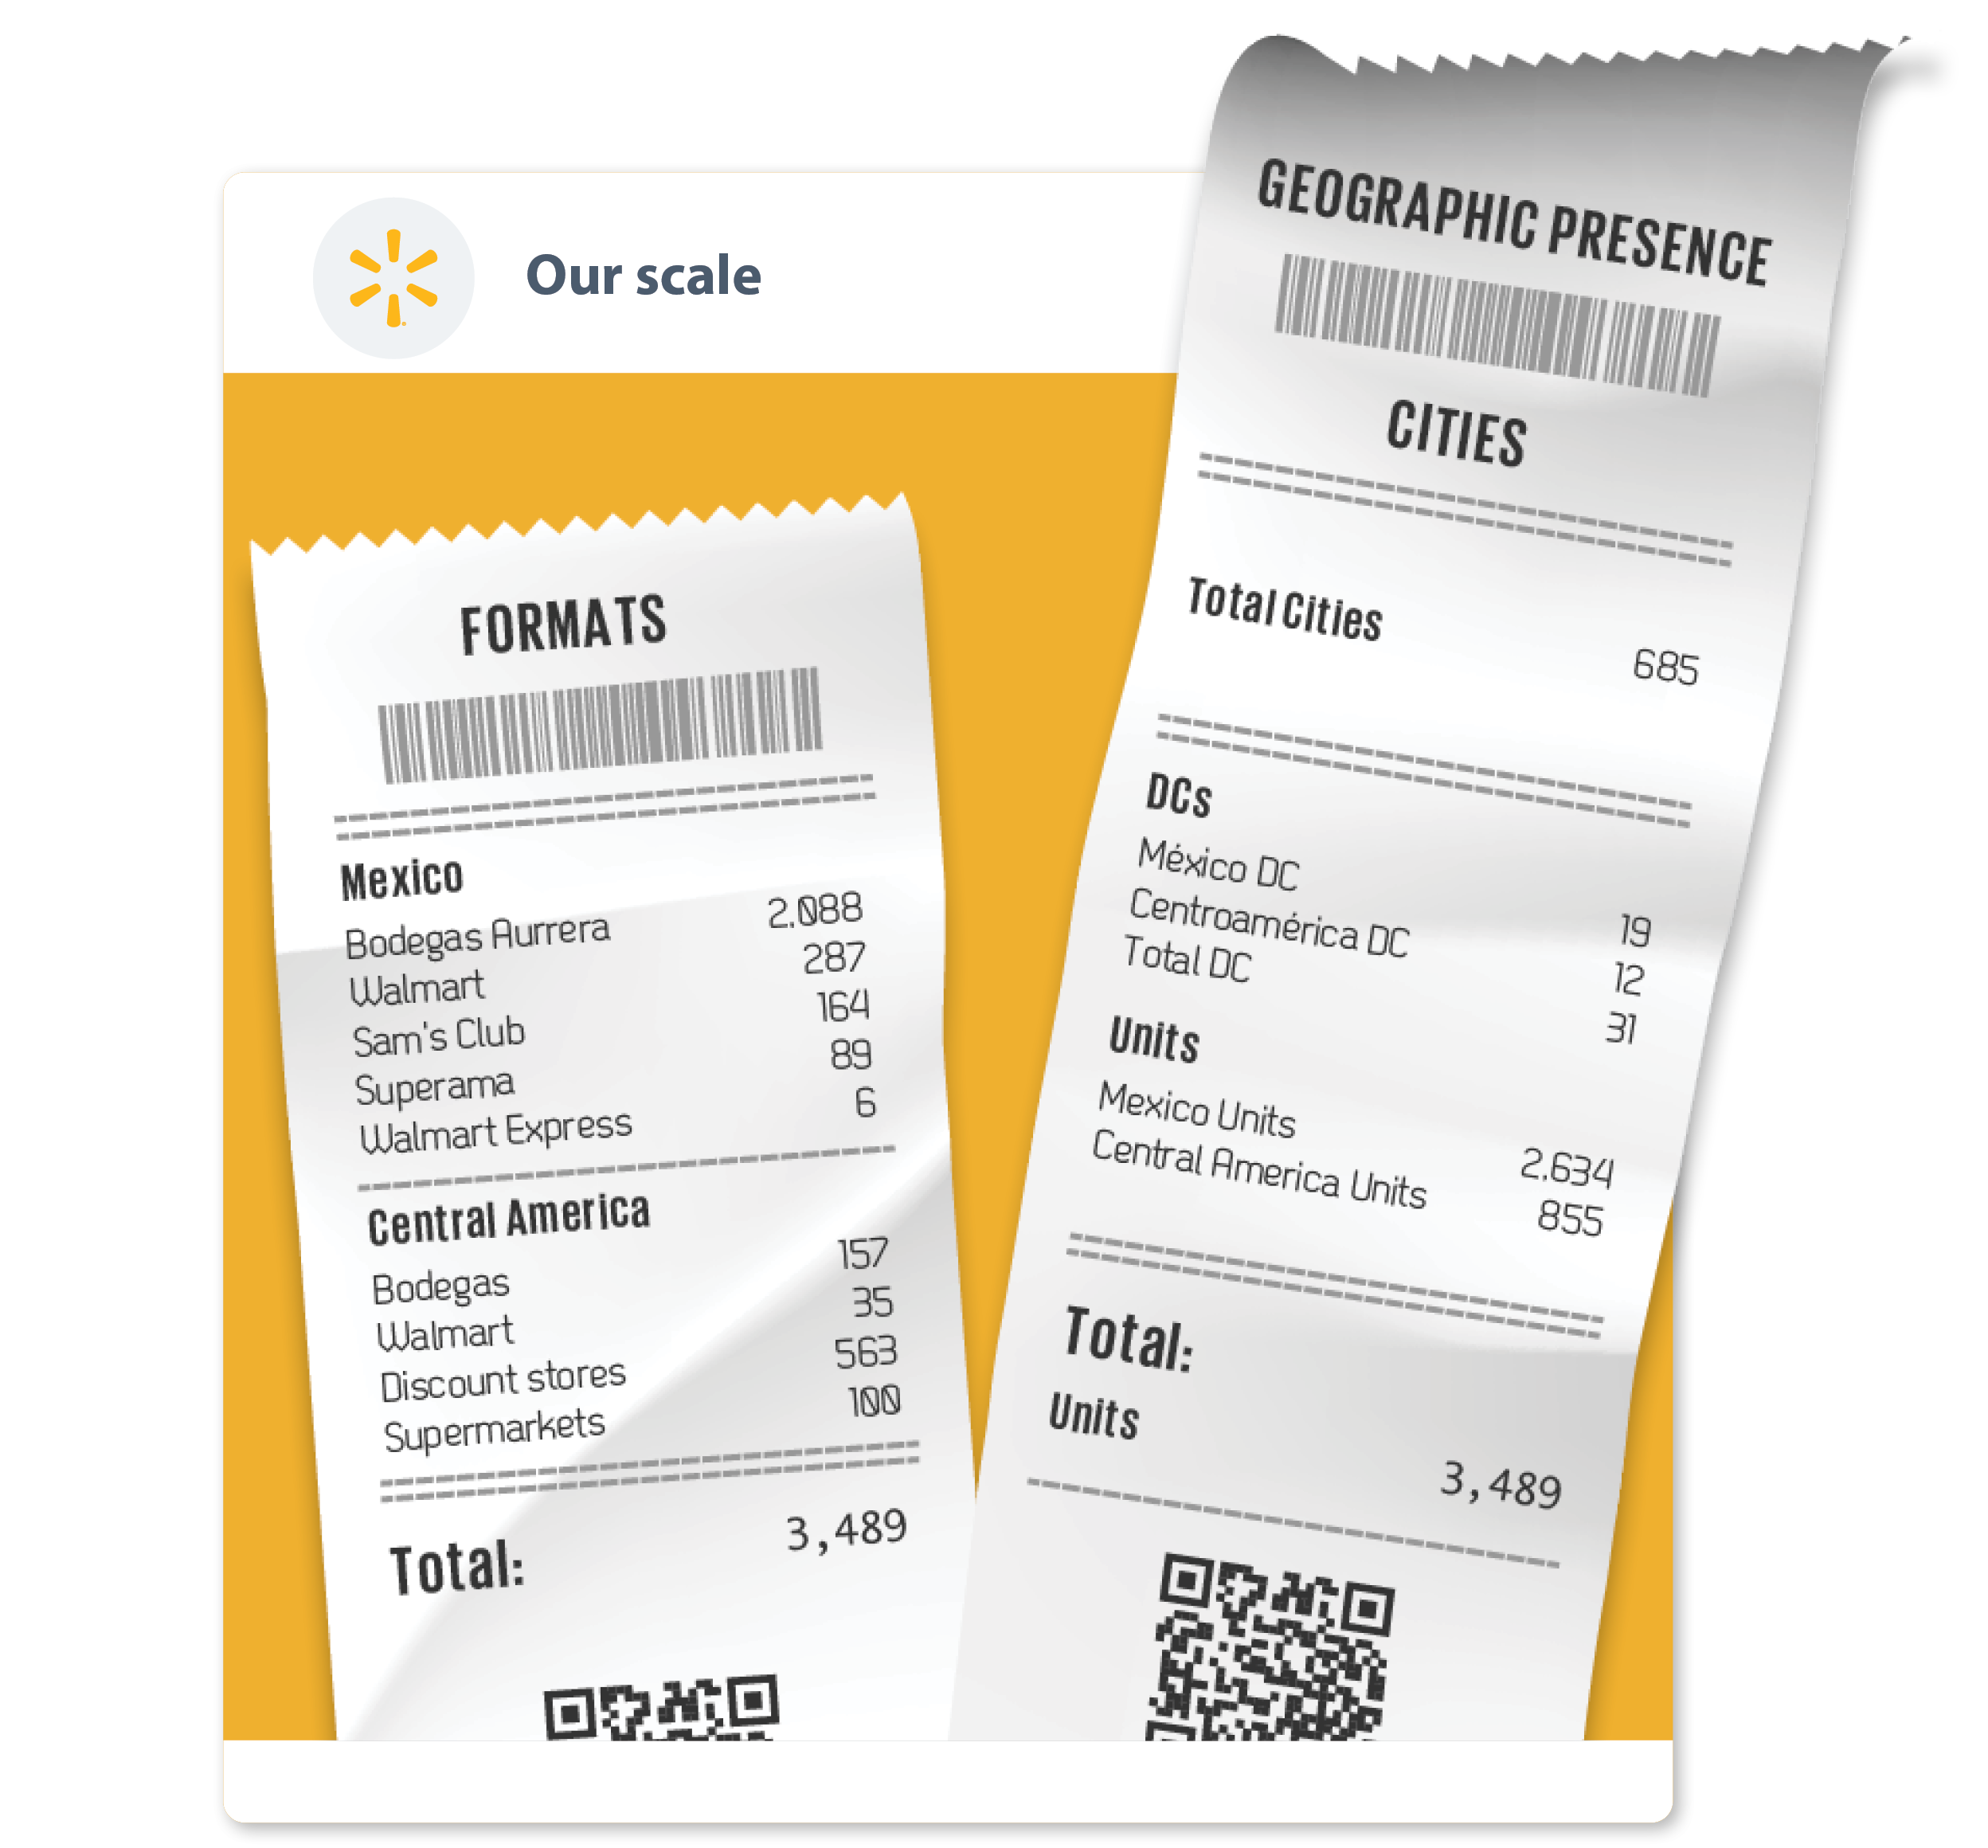
Once restrictions were lifted by the authorities, during the year we resumed the growth of new stores at an even faster pace. We opened 82 new units, 63 in Mexico and 19 in Central America, thus contributing 1.5% to total revenue. We closed the year with a total of 3,489 stores, amounting to over 7,000,000 m2 in sales floor.
This year we made the impossible possible, and we are quite proud of our achievements. They are the product of the efforts of our associates, the preference of our customers, and our financial strength

Our Company has a robust logistics network, which we continue to reinforce. Throughout the year, we opened three new operations: a fulfillment center in the State of Mexico, which services the center of the country for sales via our eCommerce platforms, requiring an investment over 0.6 billion pesos. We additionally opened our first two omnichannel DCs; the first in Mérida, Yucatán, with an investment of more than 1.1 billion pesos, which will supply the entire country but with greater focus on the central and southeast regions; and a second one in Chihuahua, with an investment of 0.9 billion pesos.
We continue making efficient investments to protect our associates and the planet. This year we opened two Bodega Aurrera units within our DC in the State of Mexico and Mérida, created to meet their needs easier and safely. Sustainability is consistently found within our investment agenda; all our new store prototypes have solar panels, led lighting, they are hermetically sealed and have highly efficient equipment to save up to 30% in energy use.
INCOME STATEMENT AND BALANCE SHEET
At December 31, 2020 (MXN Billions)
Balance sheet
Assets
35.7
Cash
68.3
Inventories
257.9
Fixed Assets and Others
Liabilities and Equity
92.4
Accounts Payable
269.5
Equity and Others