Energy
G4-EN3, G4-EN6,
G4-EN7


We made a commitment to have our stores and DCs fully supplied 100% with renewable energy, with the purpose of mitigating the effects of climate change.
We continuously seek newer and better energy supply alternatives to meet our goal and at the same time implement efficient energy use initiatives, and for several years we have added the challenge of generating layer over layer of savings.
Through several initiatives implemented in Central America, such as education and awareness campaigns, constant reporting on consumption levels, and follow-up at all levels of the business,
We are the leading retail chain in
the use of renewable energy
in addition to investing in the modernization of technology and the use of a Statistical Model in existing stores, we have been able to focus our efforts on finding opportunities and enhancing performance levels. Thanks to these initiatives we have been able to achieve a 2% reduction over figures for last year, thus avoiding the use of 4.9 million kWh. All new stores have been built with 100% LED lighting.
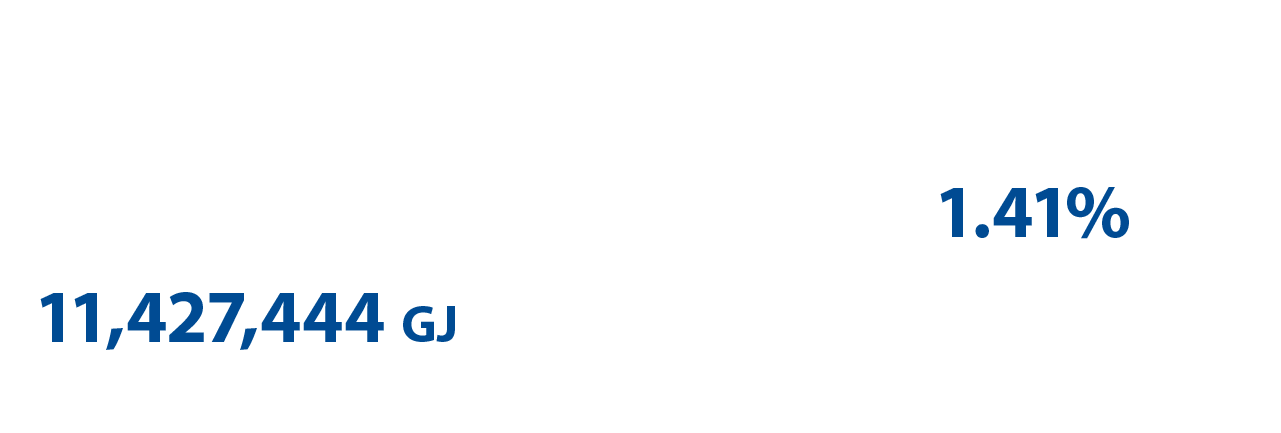
11,427,444GJ
Energy use
1.41%
Energy saving

39%
Energy from
renewable
sources

61%
Energy from fossil
fuels sources


2
Hydroelectric
power plants
6
Wind farms
91%
Of our stores are
supplied with renewable energy
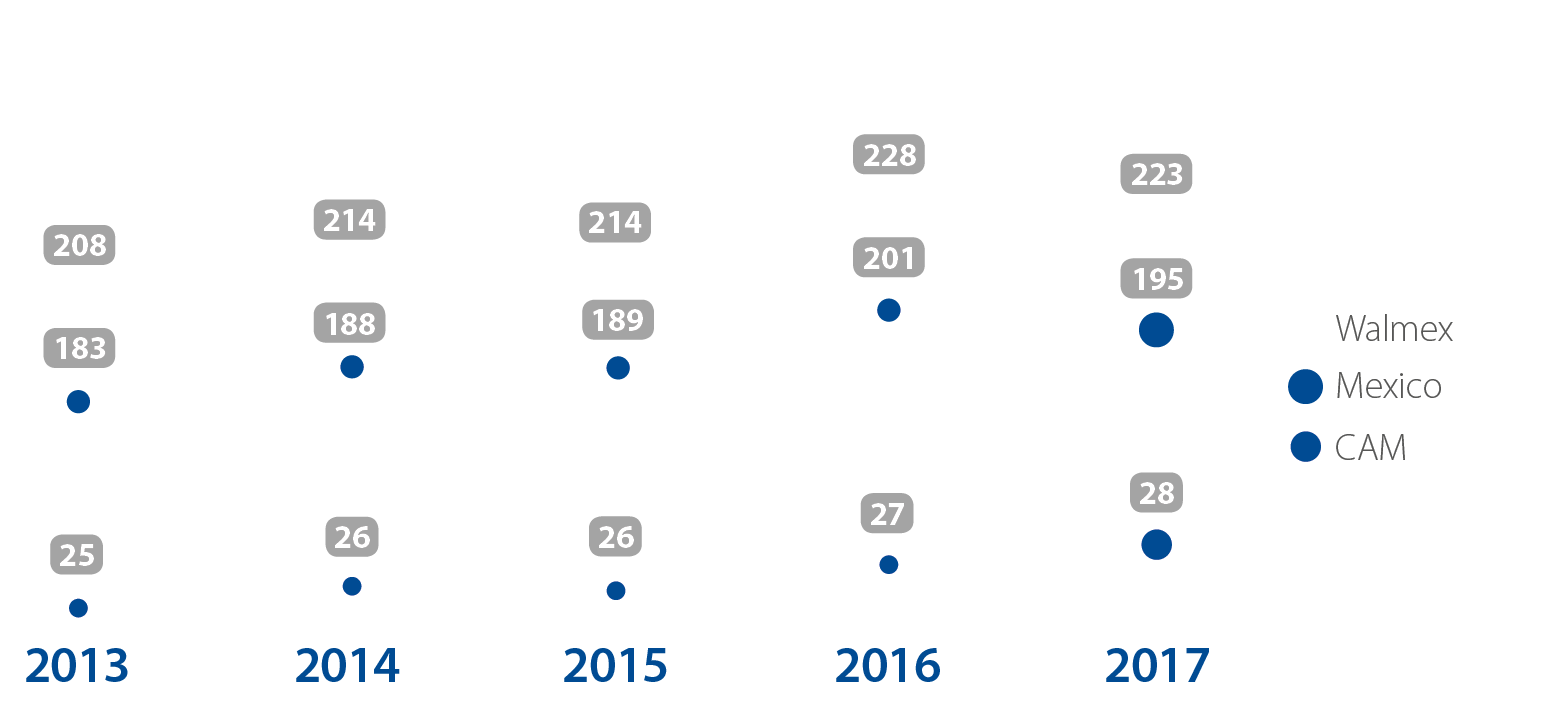
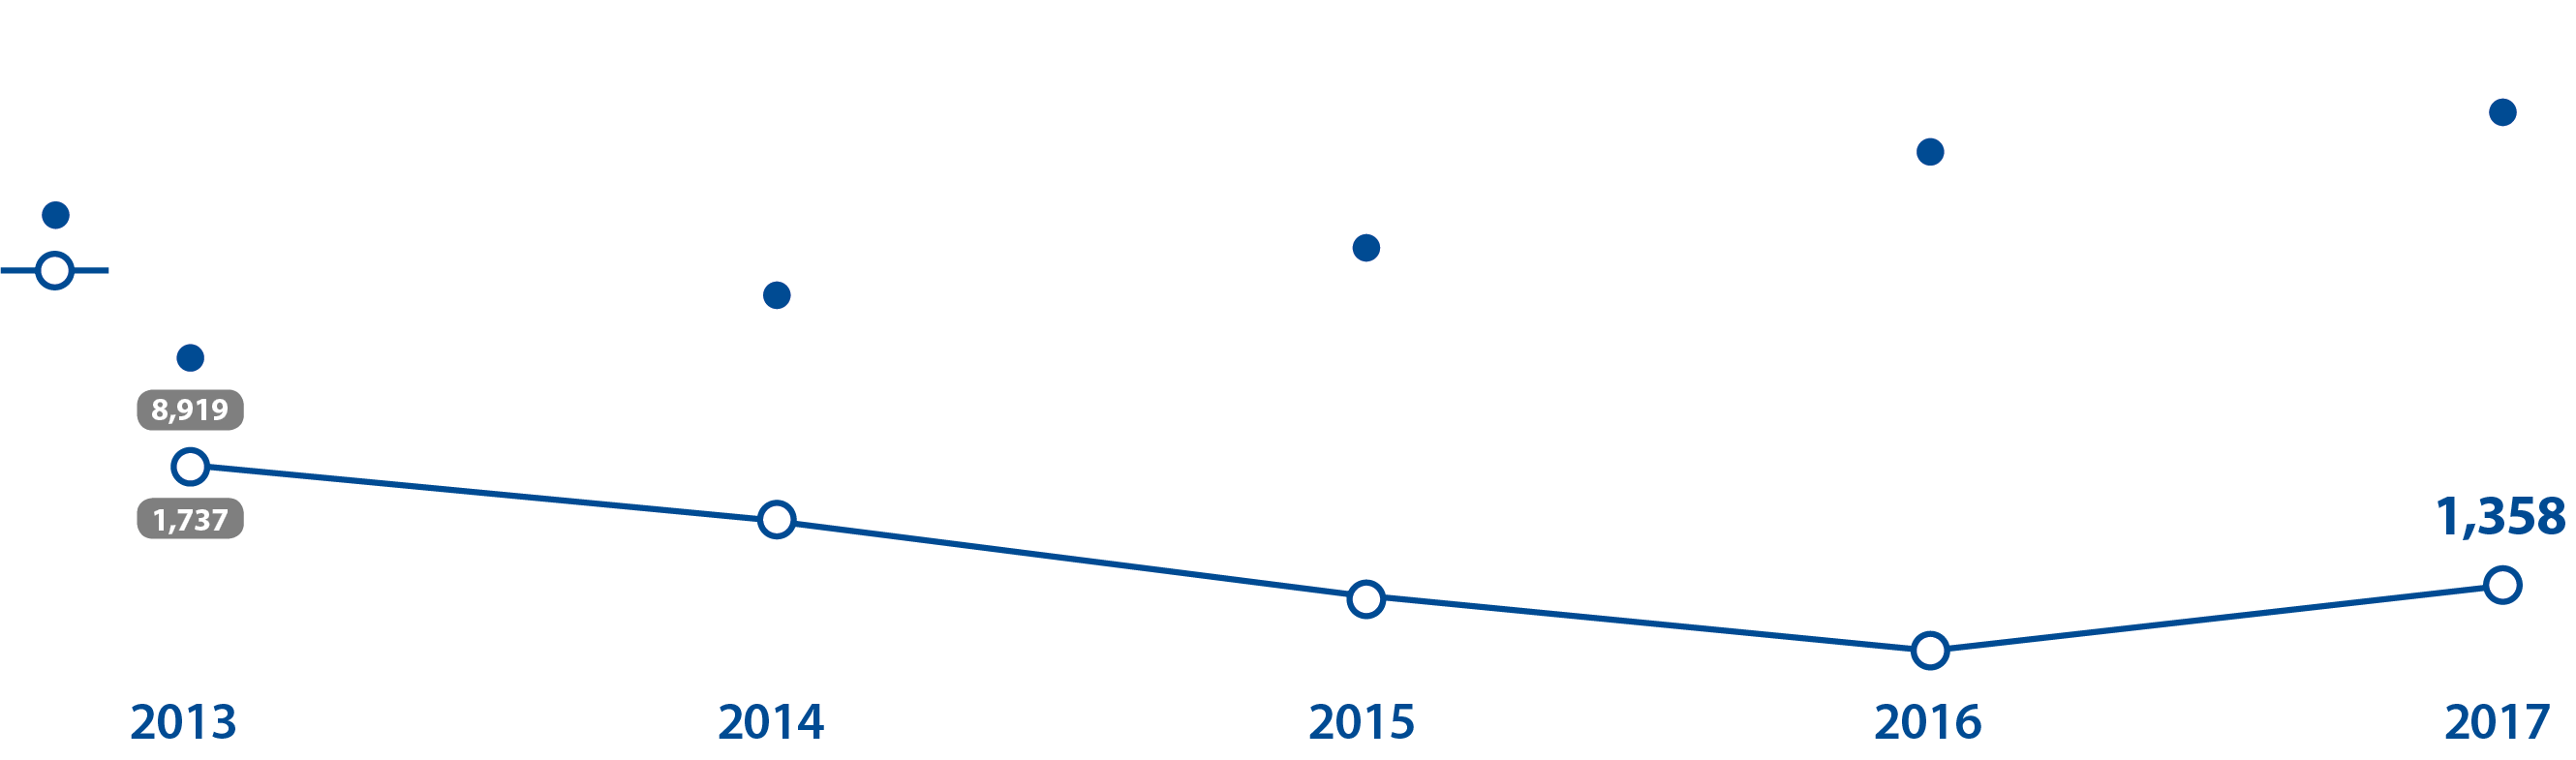
Energy intensity (kWh/m2)
G4-EN5
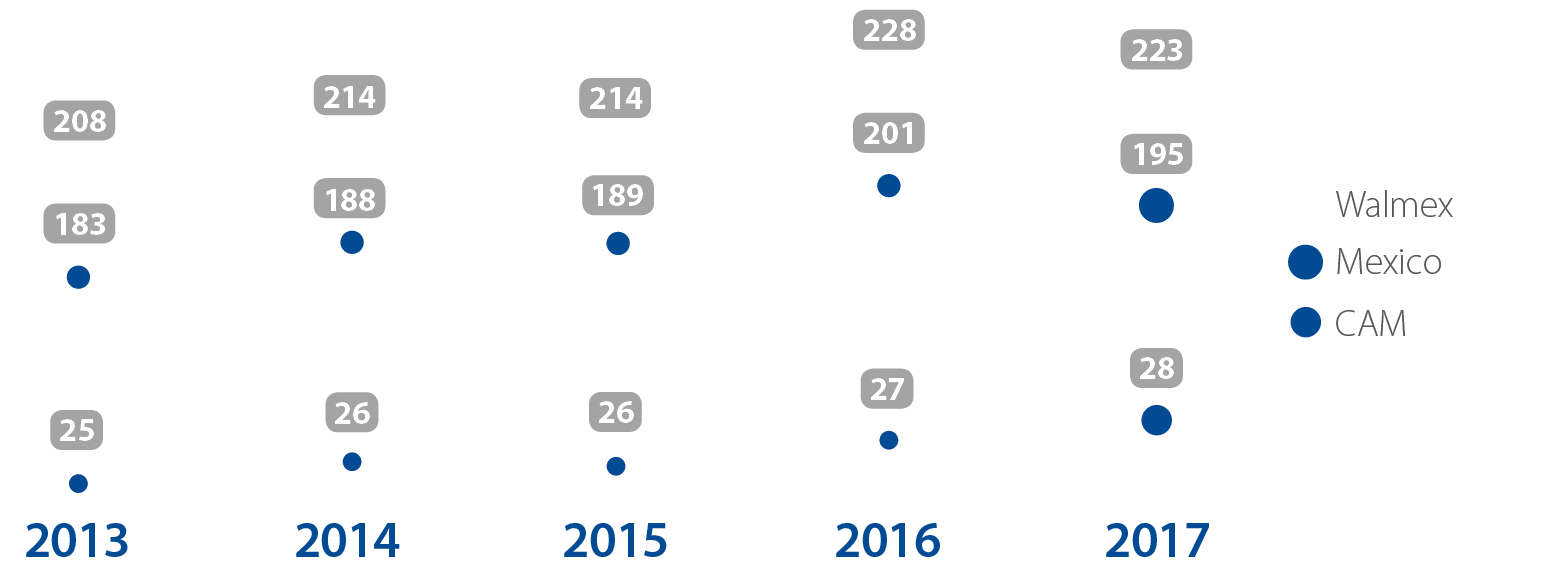
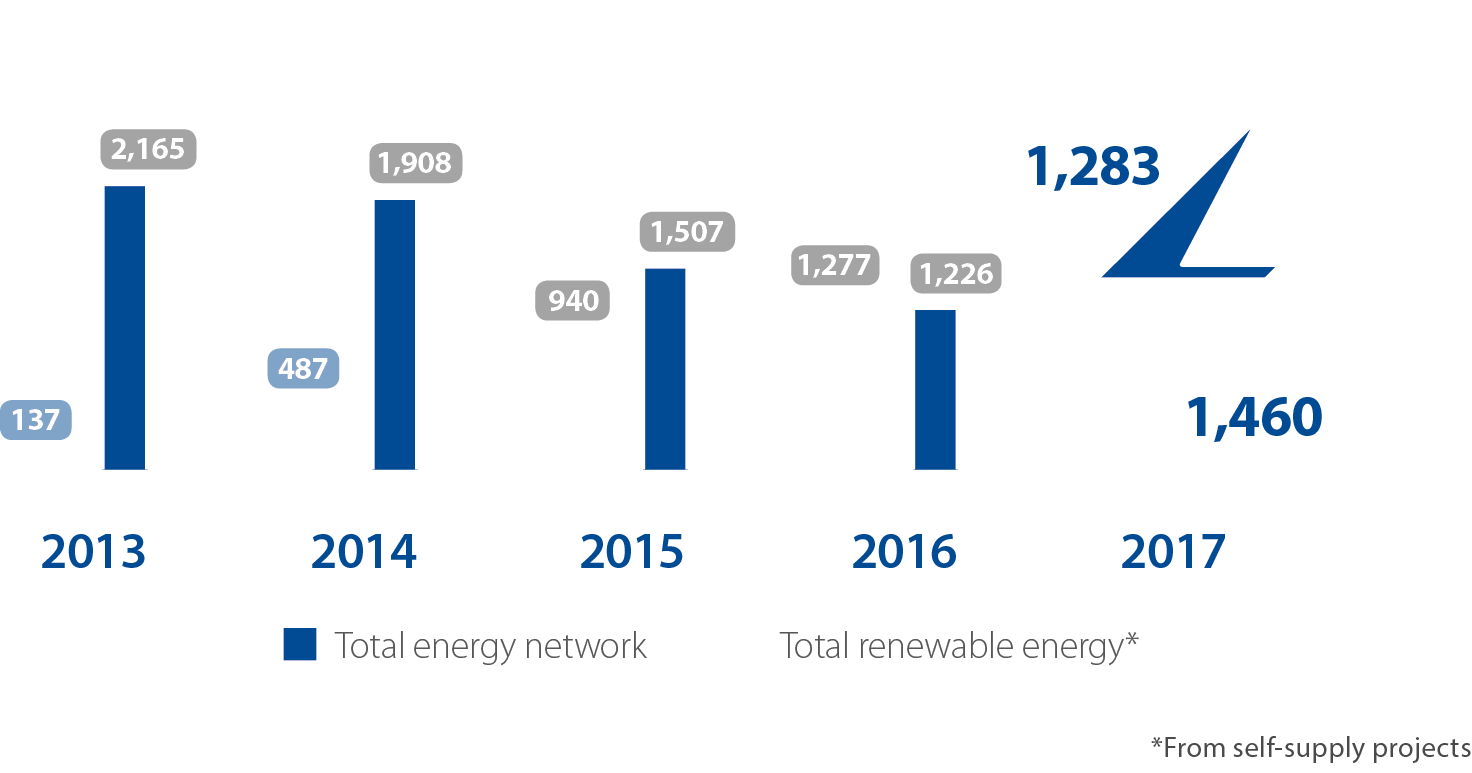
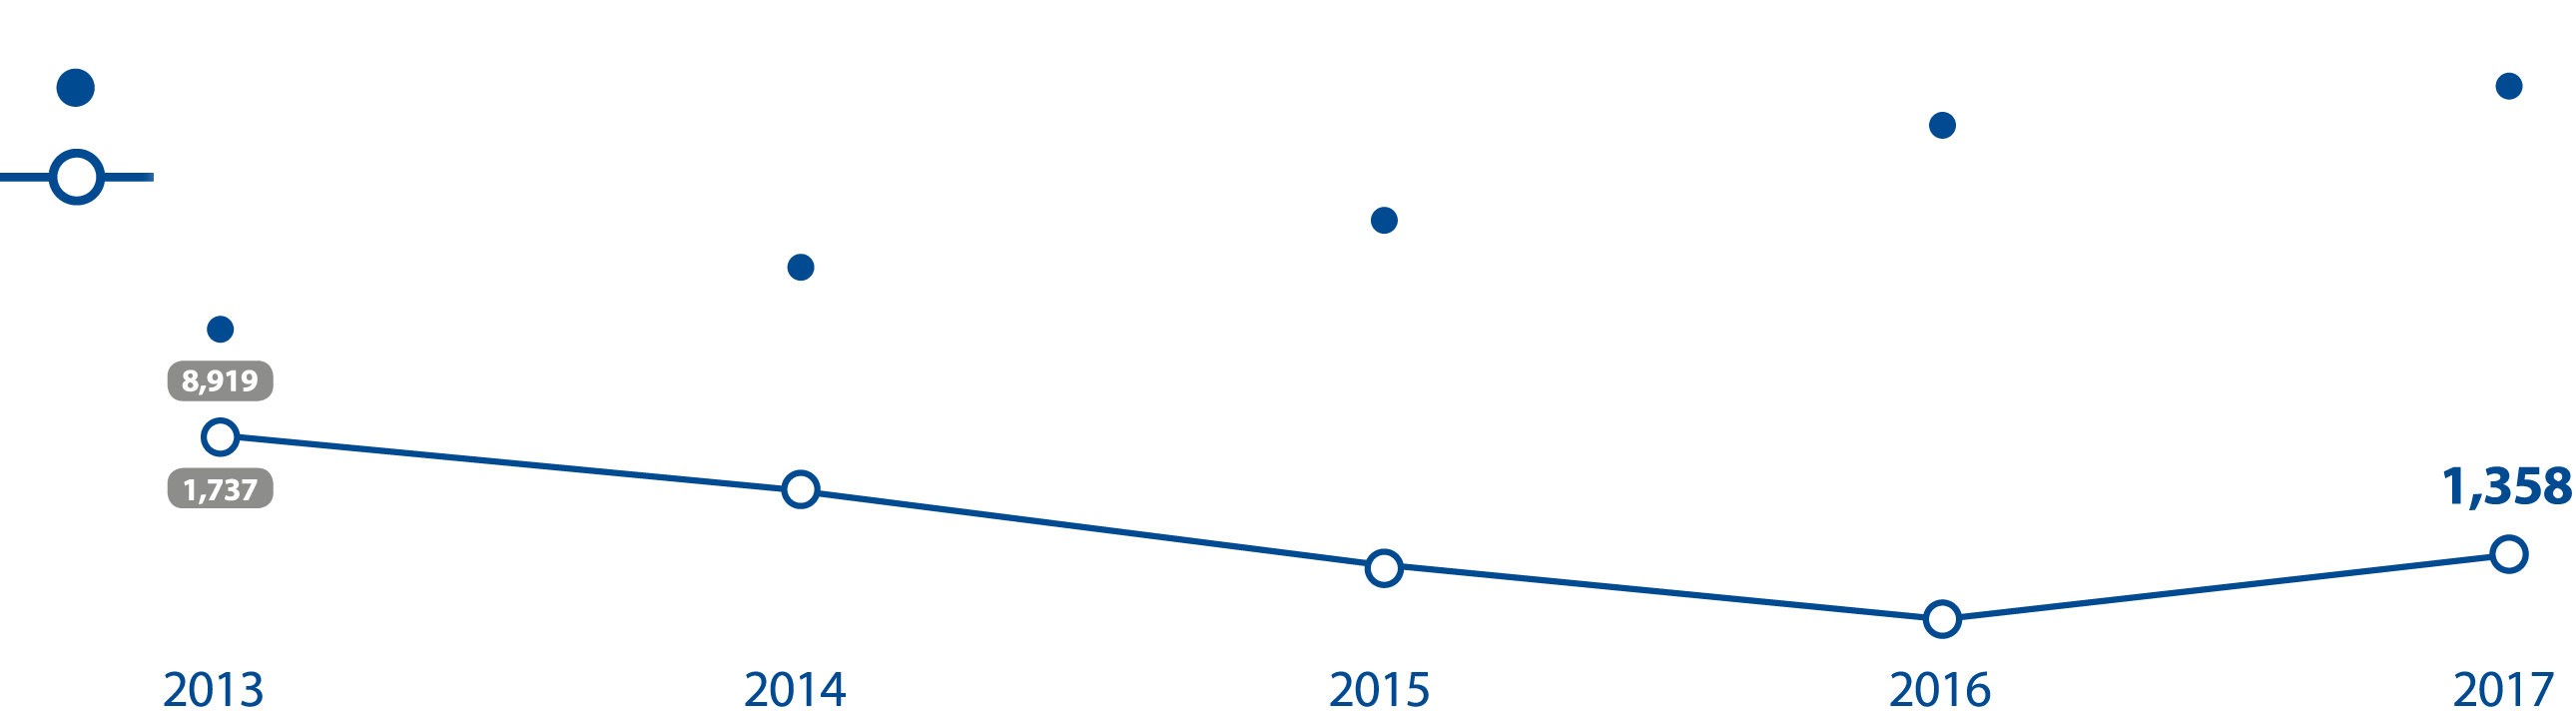
Energy use
(GWh)
2,165
137
1,908
487
1,507
940
1,226
1,277
1,283
1,460

2013
2014
2015
2016
2017
Total energy network
Total renewable energy*
Emissions
G4-EN19


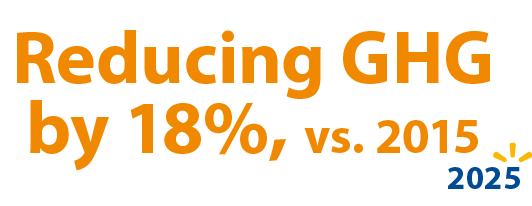
We are in line with the goal established by Walmart Inc., to reduce greenhouse gas emissions. This goal has been approved by a science-based initiative.
Reducing GHG
18%, vs. 2015

Moreover, we are building a baseline for emissions generated in our supply chain, by asking our primary suppliers to provide us with reports on the emissions generated per volume of business with Walmart Mexico.
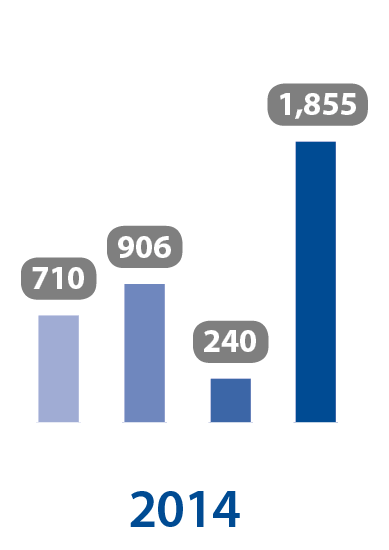
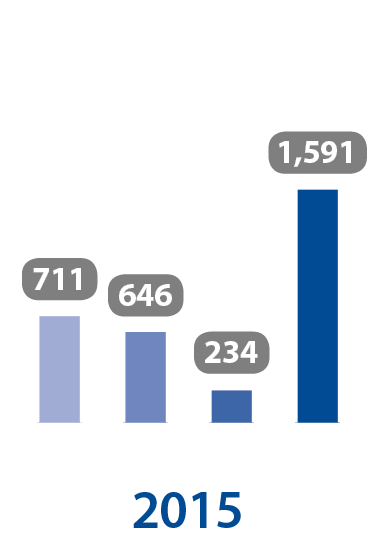
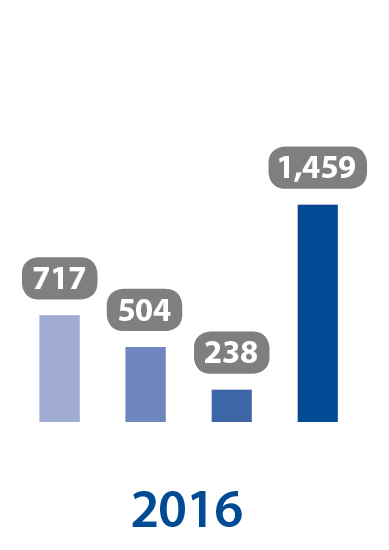
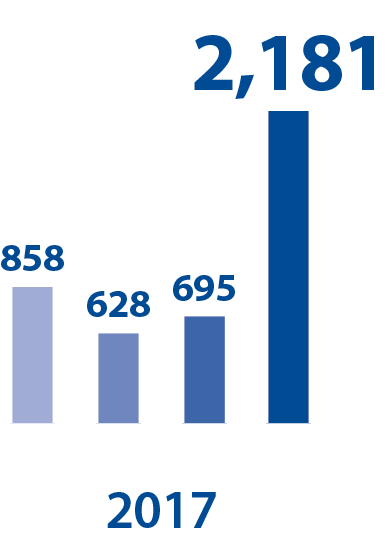
In 2017 we had an increase of scope 1 and 2 emissions, due to the fact that the September 7 earthquake in Oaxaca affected the distribution lines that supply energy from wind farms to the stores, resulting in lower consumption of clean energy.
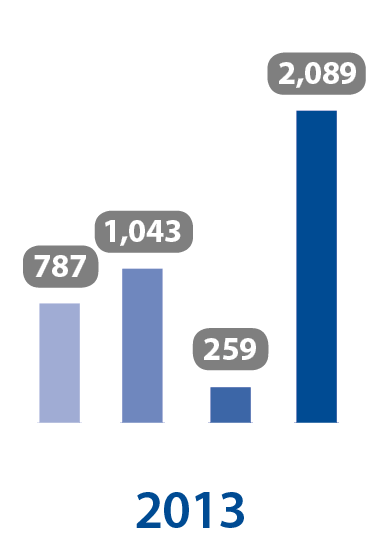
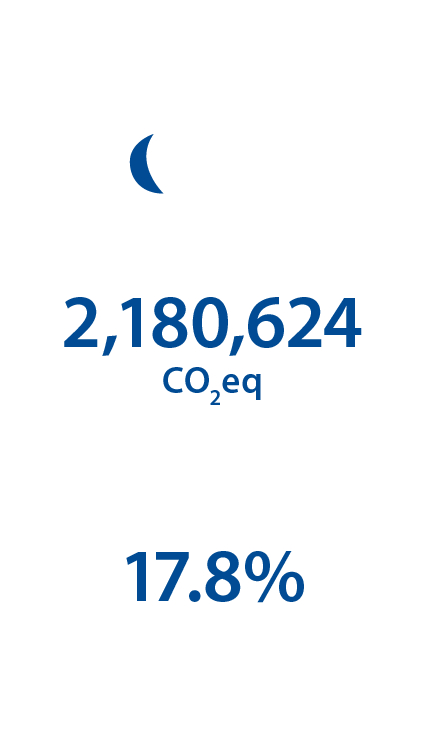
CO2 emissions throught the years
G4-EN15, G4-EN16, G4-EN17
2013
2014
2015
2016
2017
Scope 1
Scope 2
Scope 3
Scope

2,180,624
CO2eq Tons
Total emissions
17.8%
Increase of scope 1
and 2 emissions
Scope 1
Fuels
16.52%
Mexico
1.29%
CAM
Coolants
G4-EN20
76.25%
México
5.94%
CAM
Scope 2
Electricity
89.55%
Mexico
10.45%
CAM
Scope 3
Fleet
91.15%
Mexico
5.02%
CAM
Air travel by associates
3.22%
Mexico
0.22%
CAM
We have decoupled sales floor growth
from emissions level growth
G4-EN18
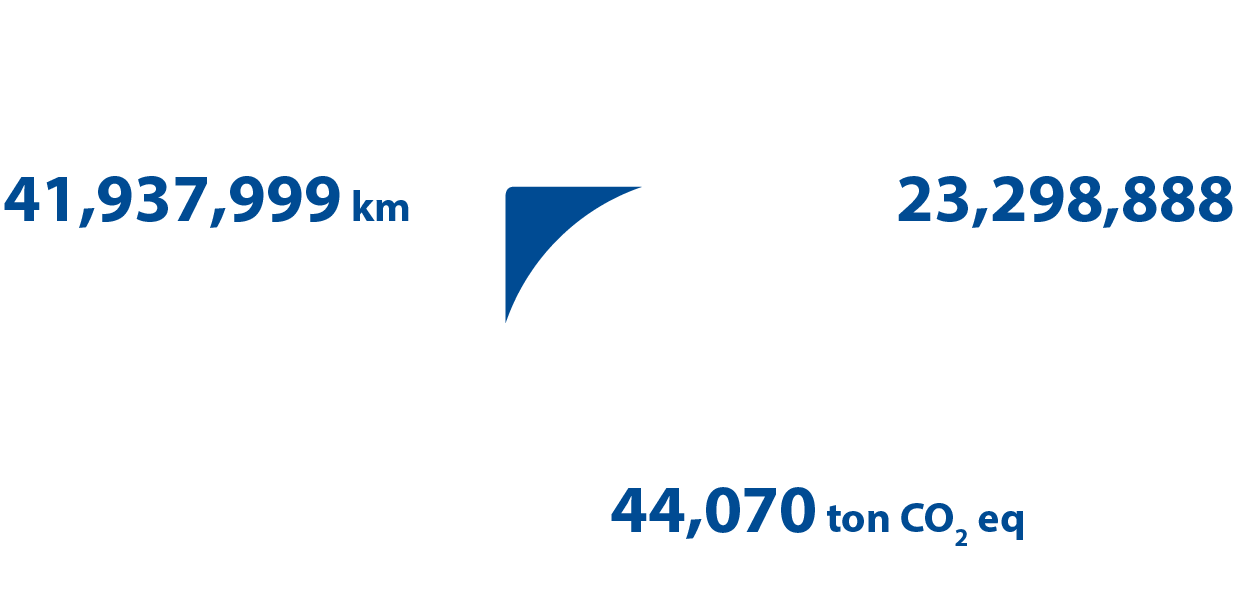
Savings from logistics initiatives
G4-EN30
41,937,999 km
No longer traveled
23,298,888 ton
Fuel liters saved
44,070 ton C02eq
Emissions saved
Supply chain
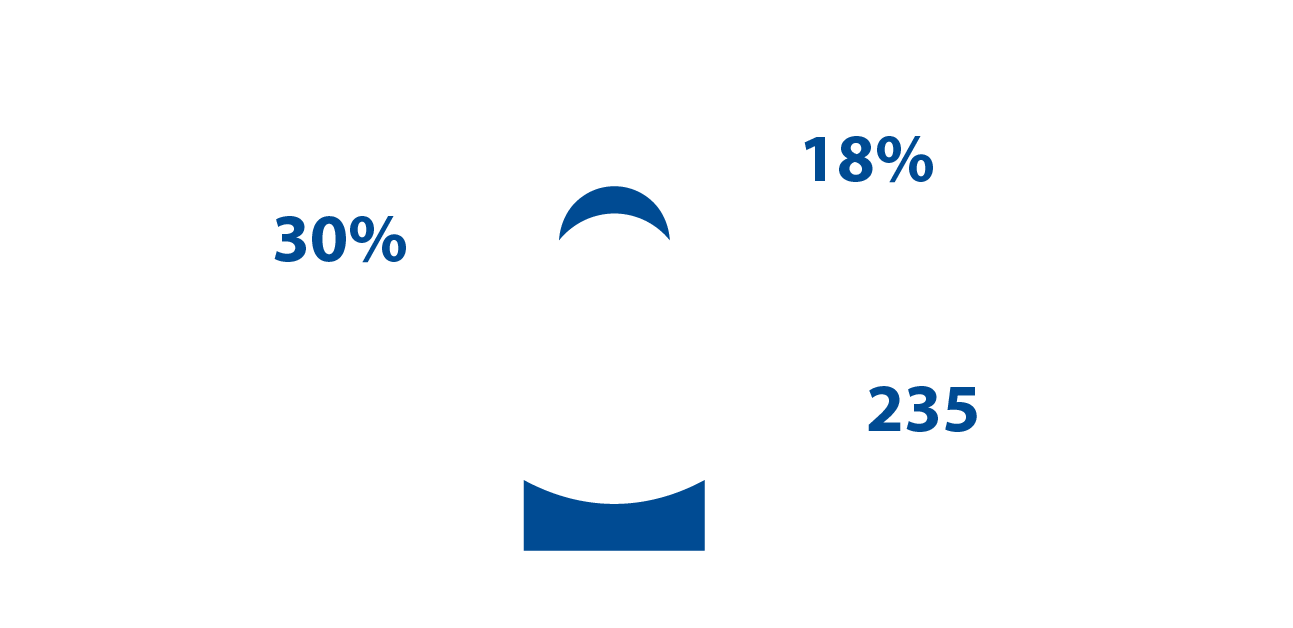
18%of suppliers
consume
renewable energy
30%of suppliers
implemented
initiatives to reduce
emission levels
235
of suppliers answered
the survey of the Supply
Chain CDP reporting
their CO2 emissions
Climate
change risks
G4-EC2
Rising
sea levels
Changing
socio-economic
conditions
due to
natural disasters
International
agreements
Carbon taxes/
Carbon market
Changes in customer preferences,
choosing products having lesser
impact on the environment
Increased demand for water
reduced sources of water,
worsened water quality
Hurricanes & tropical storms, excessive rainfall and droughts
Decreased crop productivity and yields
Probability
Impact for the business